June 27, 2026
2D thermal CFD solver for data center rack cooling
Building and validating a GPU-accelerated 2D CFD solver, then applying it to realistic data center rack cooling with perforated tiles, directional fan airflow, and ASHRAE temperature compliance.
Overview
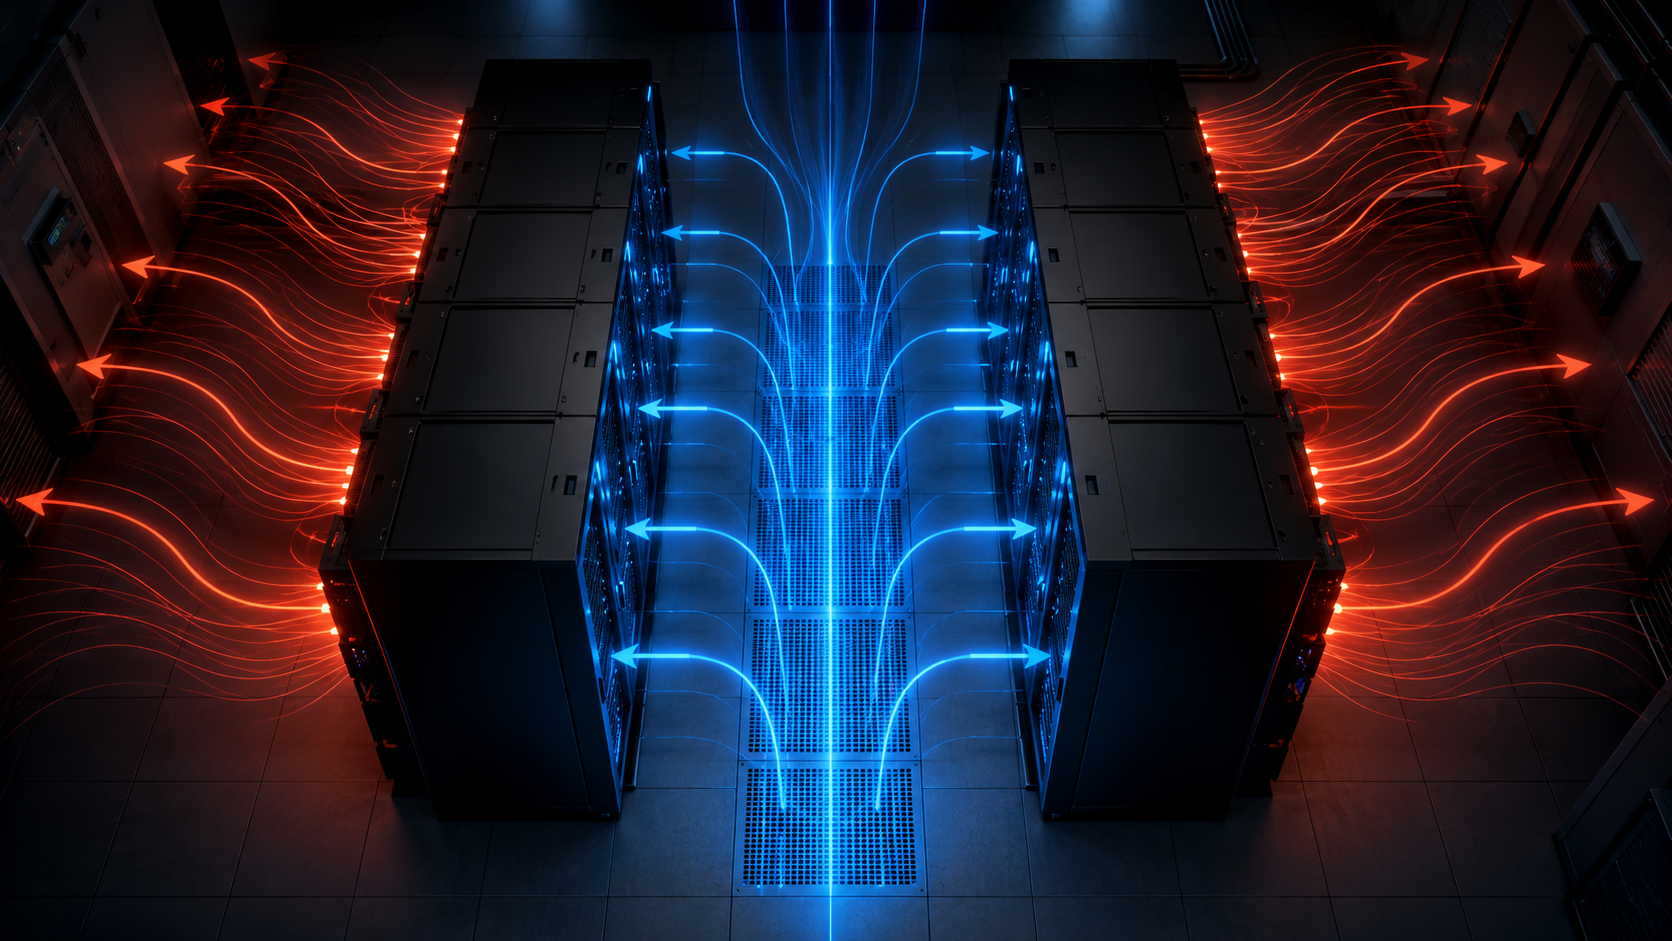
Data center cooling is one of the largest operational costs in modern computing infrastructure. Poor airflow can create hot spots, reduce hardware life, and waste energy. To reason about these flows quantitatively, we built a 2D thermal CFD solver on top of NVIDIA Warp and packaged it as an interactive Streamlit application.
The solver starts from the classic lid-driven cavity benchmark and extends it to:
- Incompressible Navier-Stokes with fractional-step projection
- Thermal advection-diffusion with buoyancy
- Porous zones representing server racks with heat generation and flow resistance
- Perforated floor tiles supplying cold air into cold aisles
- Directional rack fan airflow pushing air front-to-back through each rack
- ASHRAE A1 compliance overlay at 27°C
This post covers two parts: first, validating the solver against established benchmarks; second, applying it to a realistic 4-rack data center layout.
Part 1: Solver Validation
Lid-Driven Cavity
The lid-driven cavity is the “hello world” of CFD: a square domain with a moving top wall and no-slip walls on the other three sides. We compare our centerline velocity profiles against the benchmark data from Ghia, Ghia, and Shin (1982).
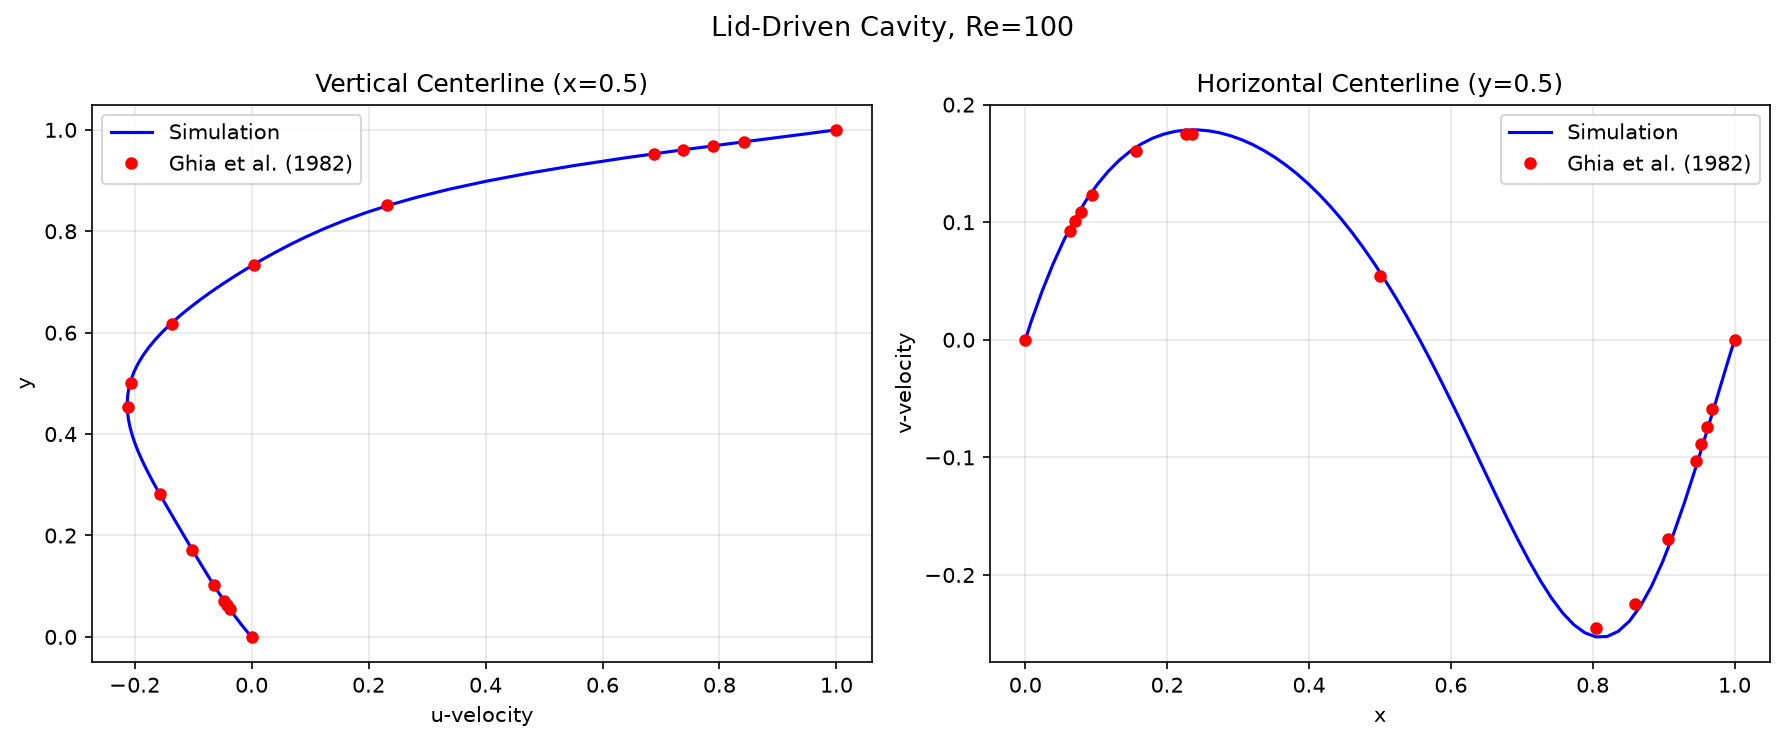
Centerline velocity profiles compared against Ghia et al. (1982) at Re = 100.
On a 64×64 grid the solver achieves:
- u-velocity centerline: ~2.4% max error
- v-velocity centerline: ~5.6% max error
- Overall: PASS within 6% tolerance
Error drops to roughly 3% on finer grids, confirming the expected spatial convergence.
Velocity Field
A snapshot of the velocity magnitude shows the characteristic primary vortex and the corner eddies that define the benchmark flow.
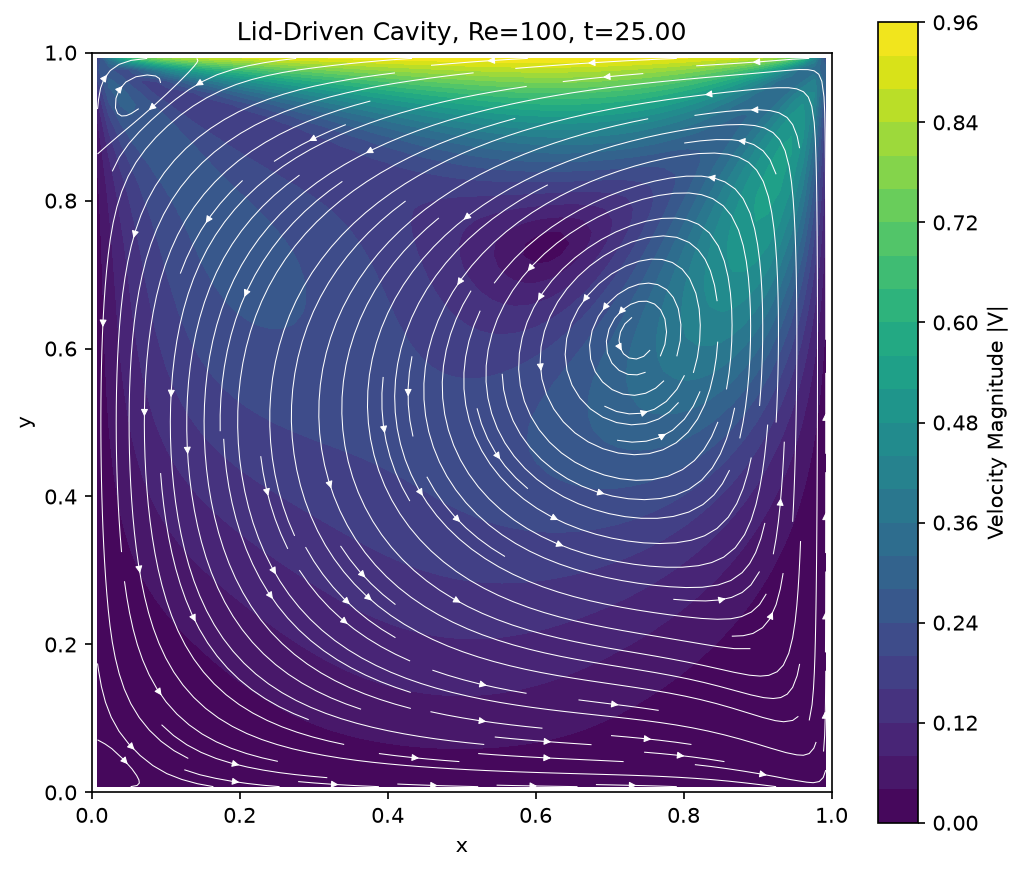
Velocity magnitude and streamlines for the lid-driven cavity at Re = 100.
Thermal Benchmarks
Beyond the isothermal cavity, we run two canonical thermal cases:
- Rayleigh-Bénard convection: heated bottom, cooled top, buoyancy-driven roll cells
- Heated cavity: differential side-wall temperatures driving a natural-convection loop
These cases exercise the coupled temperature and momentum equations before we add the data center geometry.
Part 2: Data Center Rack Cooling
Layout
The data center model is a 12 m × 3 m domain containing four server racks:
- Each rack is 0.6 m wide and 2.0 m tall
- Racks alternate front-facing direction (left / right) to form realistic hot and cold aisles
- Perforated floor tiles inject cold air upward from the floor
- Hot air exits through the ceiling
Directional Fan Airflow
In a real rack, server fans push air front-to-back. We model this as a horizontal momentum source inside each rack, with direction alternating to match the rack orientation. The result is visible cold-air intake on the front face and hot exhaust on the back face.
Temperature Field and ASHRAE A1 Compliance
The temperature field below shows the hot exhaust plumes and the 27°C ASHRAE A1 compliance line. Cold air from the perforated tiles keeps the inlet regions below the limit, while hot spots appear behind the racks where exhaust air recirculates.
Temperature field for a 4-rack data center layout. The dashed line marks the ASHRAE A1 27°C limit.
Interactive Demo
The Streamlit GUI lets you adjust rack spacing, power, cooling CFM, and supply temperature, then run the GPU solver and inspect thermal and airflow results in real time.
Key Takeaways
- Layout matters: racks far from perforated tiles or with poor aisle spacing see higher peak temperatures
- Fan direction matters: without front-to-back momentum, hot air recirculates and inlet temperatures rise
- ASHRAE compliance is local: a domain can be 95% compliant while individual racks still exceed 27°C
Implementation
The solver is open source under the MIT license:
- Repository: github.com/tech-microcosm/2d-thermal-cfd
- Baseline tag:
v0.1.0 - Key files:
solver.py— core Navier-Stokes solverthermal_solver.py— thermal, porous zones, and rack fan modeldatacenter_config.py— layout and boundary-condition setupgui_interface.py— Streamlit interactive interfacerun_benchmark.py— CLI benchmark runner
Conclusion
Starting from a validated 2D Navier-Stokes solver, we added thermal physics, porous racks, perforated tiles, and directional fan airflow to build a practical data center cooling simulator. The Streamlit GUI makes it easy to explore trade-offs between rack spacing, cooling CFM, and supply temperature. Future work includes 3D extension, turbulence modeling, and calibrated fan curves for real server hardware.
Experiments conducted June 2026. Solver built with NVIDIA Warp and visualized with Matplotlib inside Streamlit.